Reading the Opening Imbalance on a Single Name

Most people look at the imbalance number once, at nine fifteen, and treat it as a forecast. That is the reason orb trading stocks bizstone keeps a page on it, because the figure is a running tally of unmatched orders rather than a prediction, and anyone trading the opening range on equities is better served by watching how it moves across the last fifteen minutes than by reading a single snapshot of it before the opening bell.
What the Feed Publishes
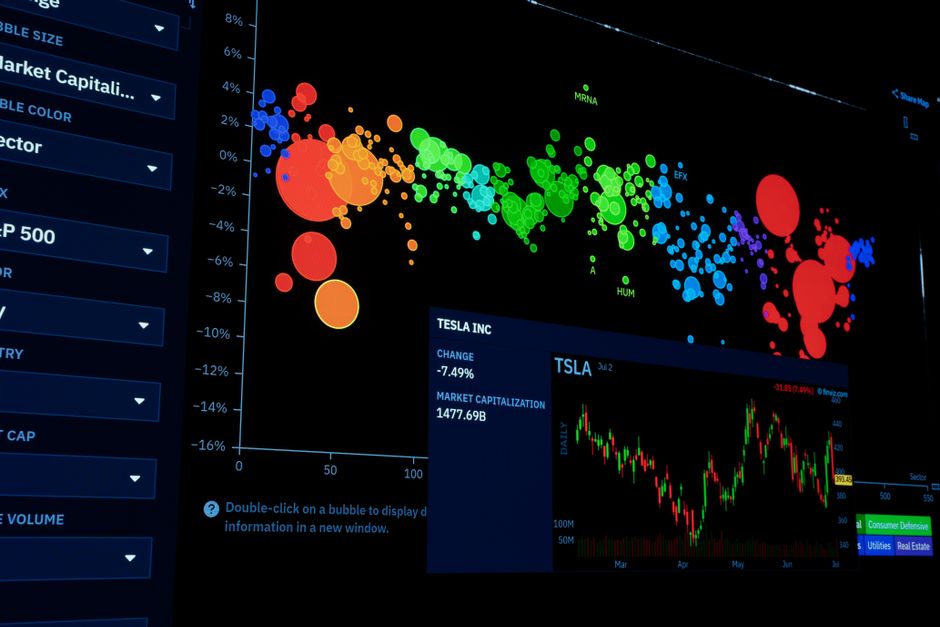
Ahead of the cash open the primary exchange disseminates the size of the imbalance, the side it sits on, and an indicative clearing price. The data starts early and updates frequently. It is a picture of orders already entered into the opening auction, and orders can be entered, amended or cancelled right up to the cutoff, which is why the shape of the number matters more than any one reading of it.
Direction of Travel Beats Magnitude

An imbalance of four hundred thousand shares to buy means very little on its own. The same figure means a great deal when it started at eighty thousand at nine fifteen and grew steadily every update since. A number that peaks early and then shrinks is being met by the other side, and the open that follows is usually quieter than the headline suggested. Recording the reading at three or four fixed times, rather than glancing at it, is what turns this into information.
Scale It to the Name
A million share imbalance on a heavily traded index constituent is routine. The same figure on a share that averages two million shares for the whole session is enormous. The comparison worth making is imbalance against typical first fifteen minutes volume for that specific name, and that ratio is what tends to line up with a wide opening range rather than the raw number.
The Indicative Price and the Gap
The indicative clearing price is the closest thing available to an actual opening print, and it typically converges in the final two minutes. Watching it settle is more useful than watching the last premarket trade, which may be a few hundred shares in a thin book. Where the indicative sits relative to the previous day high or previous day low frames the gap before the market open has even happened.
What It Does Not Tell You
The feed says nothing about intent. A large buy imbalance can be an index fund with a mandate, a closing hedge, or genuine demand, and the tape after the open behaves differently in each case. It also says nothing about the hour that follows. Plenty of names open on a heavy buy imbalance and spend the first hour selling off, so the imbalance belongs in the preparation notes as context and never as an entry signal.